Math
For Math quarter, just like other quarters, there isn't much of a sample task because math is mostly about the numbers. But I will tell you one thing, for math this quarter, we really focused on graphs. We learned total of 8 graphs. Since I got to the Higher Level math, we learned more graphs. Here are the list of graphs that we learned, including the pictures.
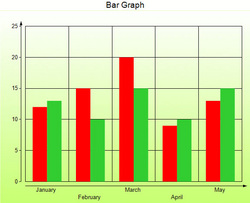 Bar Graph 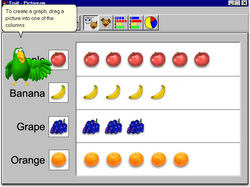 Pictogram  Frequency Table 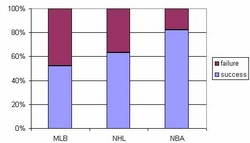 Segmented Bar Graph  Stem and Leaf |
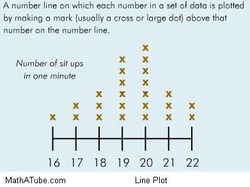 Line Plot 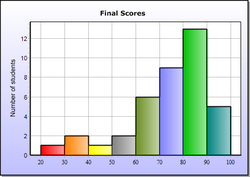 Histogram 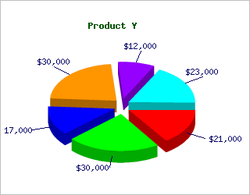 Pie Chart 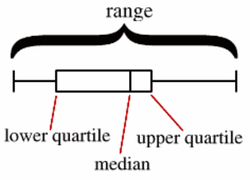 Box and Whisker |
Actually I have inserted 9 different types of graphs,but actually the frequency table is part of the histogram. But for detail, I made it into one graph. There is one graph that is not inserted above which is the line graph. There is a reason for that graph not to be inserted and it is because that graph will be used again later in the future so it is better not to rush in. From all the graphs, I believe that the hardest to learn was the box and whisker because it has too many complex things that I didn't know. The easiest graph I learned was the stem and leaf because it was plain simple. That is of course excluding the graphs I have learned which were the bar graph, pie chart and pictogram. For the test, the pictogram wasn't applied though because the teacher said it was too simple. For the criterion A test, I got a 7/8 and I believe that is a very good score because it is year's end and I achieved a high grade. I hope I can continue this way in grade 8.
